
Proceedings
A preview of the proceedings and links to preprints and supplemental material are available on conference-publishing.com. The full proceedings will soon appear on IEEE Xplore.
Program
| 09:00 | Welcome | |
| 09:15 | Papers 1: Software Behavior Chair: Fabian Beck | |
| Revealing Runtime Features and Constituent Behaviors within Software Vijay Krishna Palepu and James Jones | Full | |
| Unified Model for Software Engineering Data Anna-Liisa Mattila, Antti Luoto, Henri Terho, Otto Hylli, Outi Sievi-Korte and Kari Systä | NIER | |
| Pixel-Oriented Techniques for Visualizing Next-Generation HPC Systems Joseph Cottam, Ben Martin, Luke Dalessandro and Andrew Lumsdaine | NIER | |
| Kayrebt: An Activity Diagram Extraction and Visualization Toolset Designed for the Linux Codebase Laurent Georget, Frédéric Tronel and Valérie Viet Triem Tong | Tool | |
| 10:30 | Coffee Break | |
| 11:00 | Papers 2: User Studies and Outreach Chair: Andrea Mocci | |
| OrionPlanning: Improving Modularization and Checking Consistency on Software Architecture Gustavo Santos, Nicolas Anquetil, Anne Etien, Stéphane Ducasse and Marco Tulio Valente | Tool | |
| Hierarchical Software Landscape Visualization for System Comprehension: A Controlled Experiment Florian Fittkau, Alexander Krause and Wilhelm Hasselbring | Full, Artifact | On Understanding How Developers Use the Spotter Search Tool Juraj Kubelka, Alexandre Bergel, Andrei Chis, Tudor Girba, Stefan Reichhart, Romain Robbes and Aliaksei Syrel | NIER |
| SPIDER SENSE: Software-Engineering, Networked, System Evaluation Nishaanth Reddy, Junghun Kim, Vijay Krishna Palepu and James Jones | Tool | |
| 12:15 | Lunch break | |
| 13:30 | Informal Tool Demos 1 | |
| 14:00 | Keynote: Pervasive Software Visualizations Chair: Alexandre Bergel | |
| 15:30 | Coffee Break | |
| 16:00 | Papers 3: Software Metrics Chair: Craig Anslow | |
| Explora: a Visualisation Tool for Metric Analysis of Software Corpora Leonel Merino, Mircea Lungu and Oscar Nierstrasz | Tool | |
| Visualising Software as a Particle System Simon Scarle and Neil Walkinshaw | Full | |
| Visual Analytics of Software Structure and Metrics Taimur Khan, Henning Barthel, Achim Ebert and Peter Liggesmeyer | Full | |
| A Visual Support for Decomposing Complex Feature Models Simon Urli, Alexandre Bergel, Mireille Blay-Fornarino, Philippe Collet, Sébastien Mosser | Full | |
| 17:30 | End of the session | |
| 18:45 | Social event | |
| 09:00 | Papers 4: Visual Debugging Chair: Takashi Ishio | |
| Advancing Data Race Investigation and Classification through Visualization Nikolaos Koutsopoulos, Mandy Northover, Timm Felden and Martin Wittiger | Tool | |
| Vestige - A Visualization Framework for Engineering Geometry-Related Software Teseo Schneider, Patrick Zulian, Mohammad Reza Azadmanesh, Rolf Krause and Matthias Hauswirth | Full | |
| From Robots to Humans: Visualizations for Robot Sensor Data Miguel Campusano and Johan Fabry | NIER | |
| Visualizing interactive and shared debugging sessions Fabio Petrillo, Guilherme Lacerda, Marcelo Pimenta and Carla Freitas | NIER | |
| Live visualization of GUI application code coverage with GUITracer Arthur-Jozsef Molnar | Tool | |
| 10:30 | Coffee Break | |
| 11:00 | Papers 5: Code Similarity and Transformation Chair: Jürgen Döllner | |
| xViZiT: Visualizing Cognitive Units in Spreadsheets Karin Hodnigg and Martin Pinzger | Tool | |
| A Survey on Goal-Oriented Visualization of Clone Data Hamid Abdul Basit, Muhammad Hammad and Rainer Koschke | Full | |
| Extracting a Unified Directory Tree to Compare Similar Software Products Yusuke Sakaguchi, Takashi Ishio, Tetsuya Kanda and Katsuro Inoue | NIER | |
| SMNLV: A Small-Multiples Node-Link Visualization Supporting Software Comprehension by Displaying Multiple Relationships in Software Structure Ala Abuthawabeh and Dirk Zeckzer | Tool | |
| Polyhedral User Mapping and Assistant Visualizer Tool for the R-Stream Auto-Parallelizing Compiler Eric Papenhausen, Bing Wang, M. Harper Langston, Benoit Meister, Muthu Baskaran, Tom Henretty, Taku Izubuchi, Ann Johnson, Chulwoo Jung, Meifeng Lin, Klaus Mueller and Richard Lethin | Tool | |
| 12:30 | Lunch break | |
| 13:30 | Informal Tool Demos 2 | |
| 14:00 | Papers 6: Software Maps Chair: Ethan Munson | |
| Visualization Based API Usage Patterns Refining Mohamed Aymen Saied, Omar Benomar and Houari Sahraoui | NIER | |
| CodeSurveyor: Mapping Large-Scale Software to Aid in Code Comprehension Nathan Hawes, Stuart Marshall and Craig Anslow | Full | |
| Blended, Not Stirred: Multi-concern Visualization of Large Software Systems Tommaso Dal Sasso, Roberto Minelli, Andrea Mocci and Michele Lanza | Full | |
| Research Perspective on Supporting Software Engineering via Physical 3D Models Florian Fittkau, Erik Koppenhagen and Wilhelm Hasselbring | NIER | |
| Exploring Software Cities in Virtual Reality Florian Fittkau, Alexander Krause and Wilhelm Hasselbring | NIER | |
| 15:30 | Coffee Break | |
| 16:00 | Papers 7: Software Evolution Chair: Michel Wermelinger | |
| Visualizing Work Processes in Software Engineering with Developer Rivers Michael Burch, Tanja Munz, Fabian Beck and Daniel Weiskopf | Full | |
| Interactive Tag Cloud Visualization of Software Version Control Repositories Gillian Greene and Bernd Fischer | Full, Artifact | |
| Stable Voronoi-based Visualizations for Software Quality Monitoring Rinse van Hees and Jurriaan Hage | Full | |
| 17:15 | Closing | |
| 17:30 | End of the conference | |
| 17:30 | Steering Committee Elections | |
| 18:00 | End of the Steering Committee Elections | |
Keynote: Tudor Gîrba, Pervasive Software Visualizations

Abstract. "A picture tells a thousand words." Everyone knows that. Then why are our development tools showing mainly text with so much obstinacy? Even when visualizations do make it in our tools, they don’t make it past the periphery. Something is deeply wrong.
A significant part of the problem stems from the perception that software development is an activity of producing code. Yet, we know since a long time that developers spend the largest chunk of their time on understanding the existing system. Nevertheless, the IDE still favors the creation part. Just think about this: the central and largest part of the environment is taken by an editor, which is a tool used to enter or alter text. The IDE highly favors the typing part, but it overlooks the understanding needs. The I in the IDE is not as integrated as we might want to believe.
In this talk, we argue that the IDE has to change radically. Software systems represent perhaps the most sophisticated creations we have ever built. That is why understanding them has to be supported as a critical activity that is integrated in the overall workflow. Visualizations cannot be ostracized anymore. They have to become first class citizens in the IDE.
Bio. Tudor Gîrba obtained his PhD in 2005 from the University of Bern, and he now works as a consultant and coach.
He leads the work on the Moose platform for software and data analysis, he founded the Glamorous Toolkit project for rethinking the IDE, and he is a board member of the Pharo live programming environment.
He advocates that software assessment must be recognized as a critical software engineering activity, and he authored the humane assessment method to help teams to rethink the way they manage large software systems and data sets.
Tudor also argues that storytelling should be prominent in software development.
In 2014, he won the prestigious Dahl-Nygaard Junior Prize for his work on modeling and visualization of evolution and interplay of large numbers of objects.
Best Paper Award
This year, ObjectProfile sponsors the Best Paper Award which will be given during the social event.
Social Event
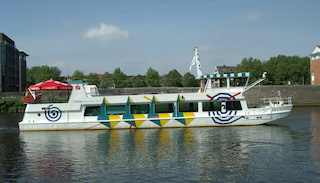
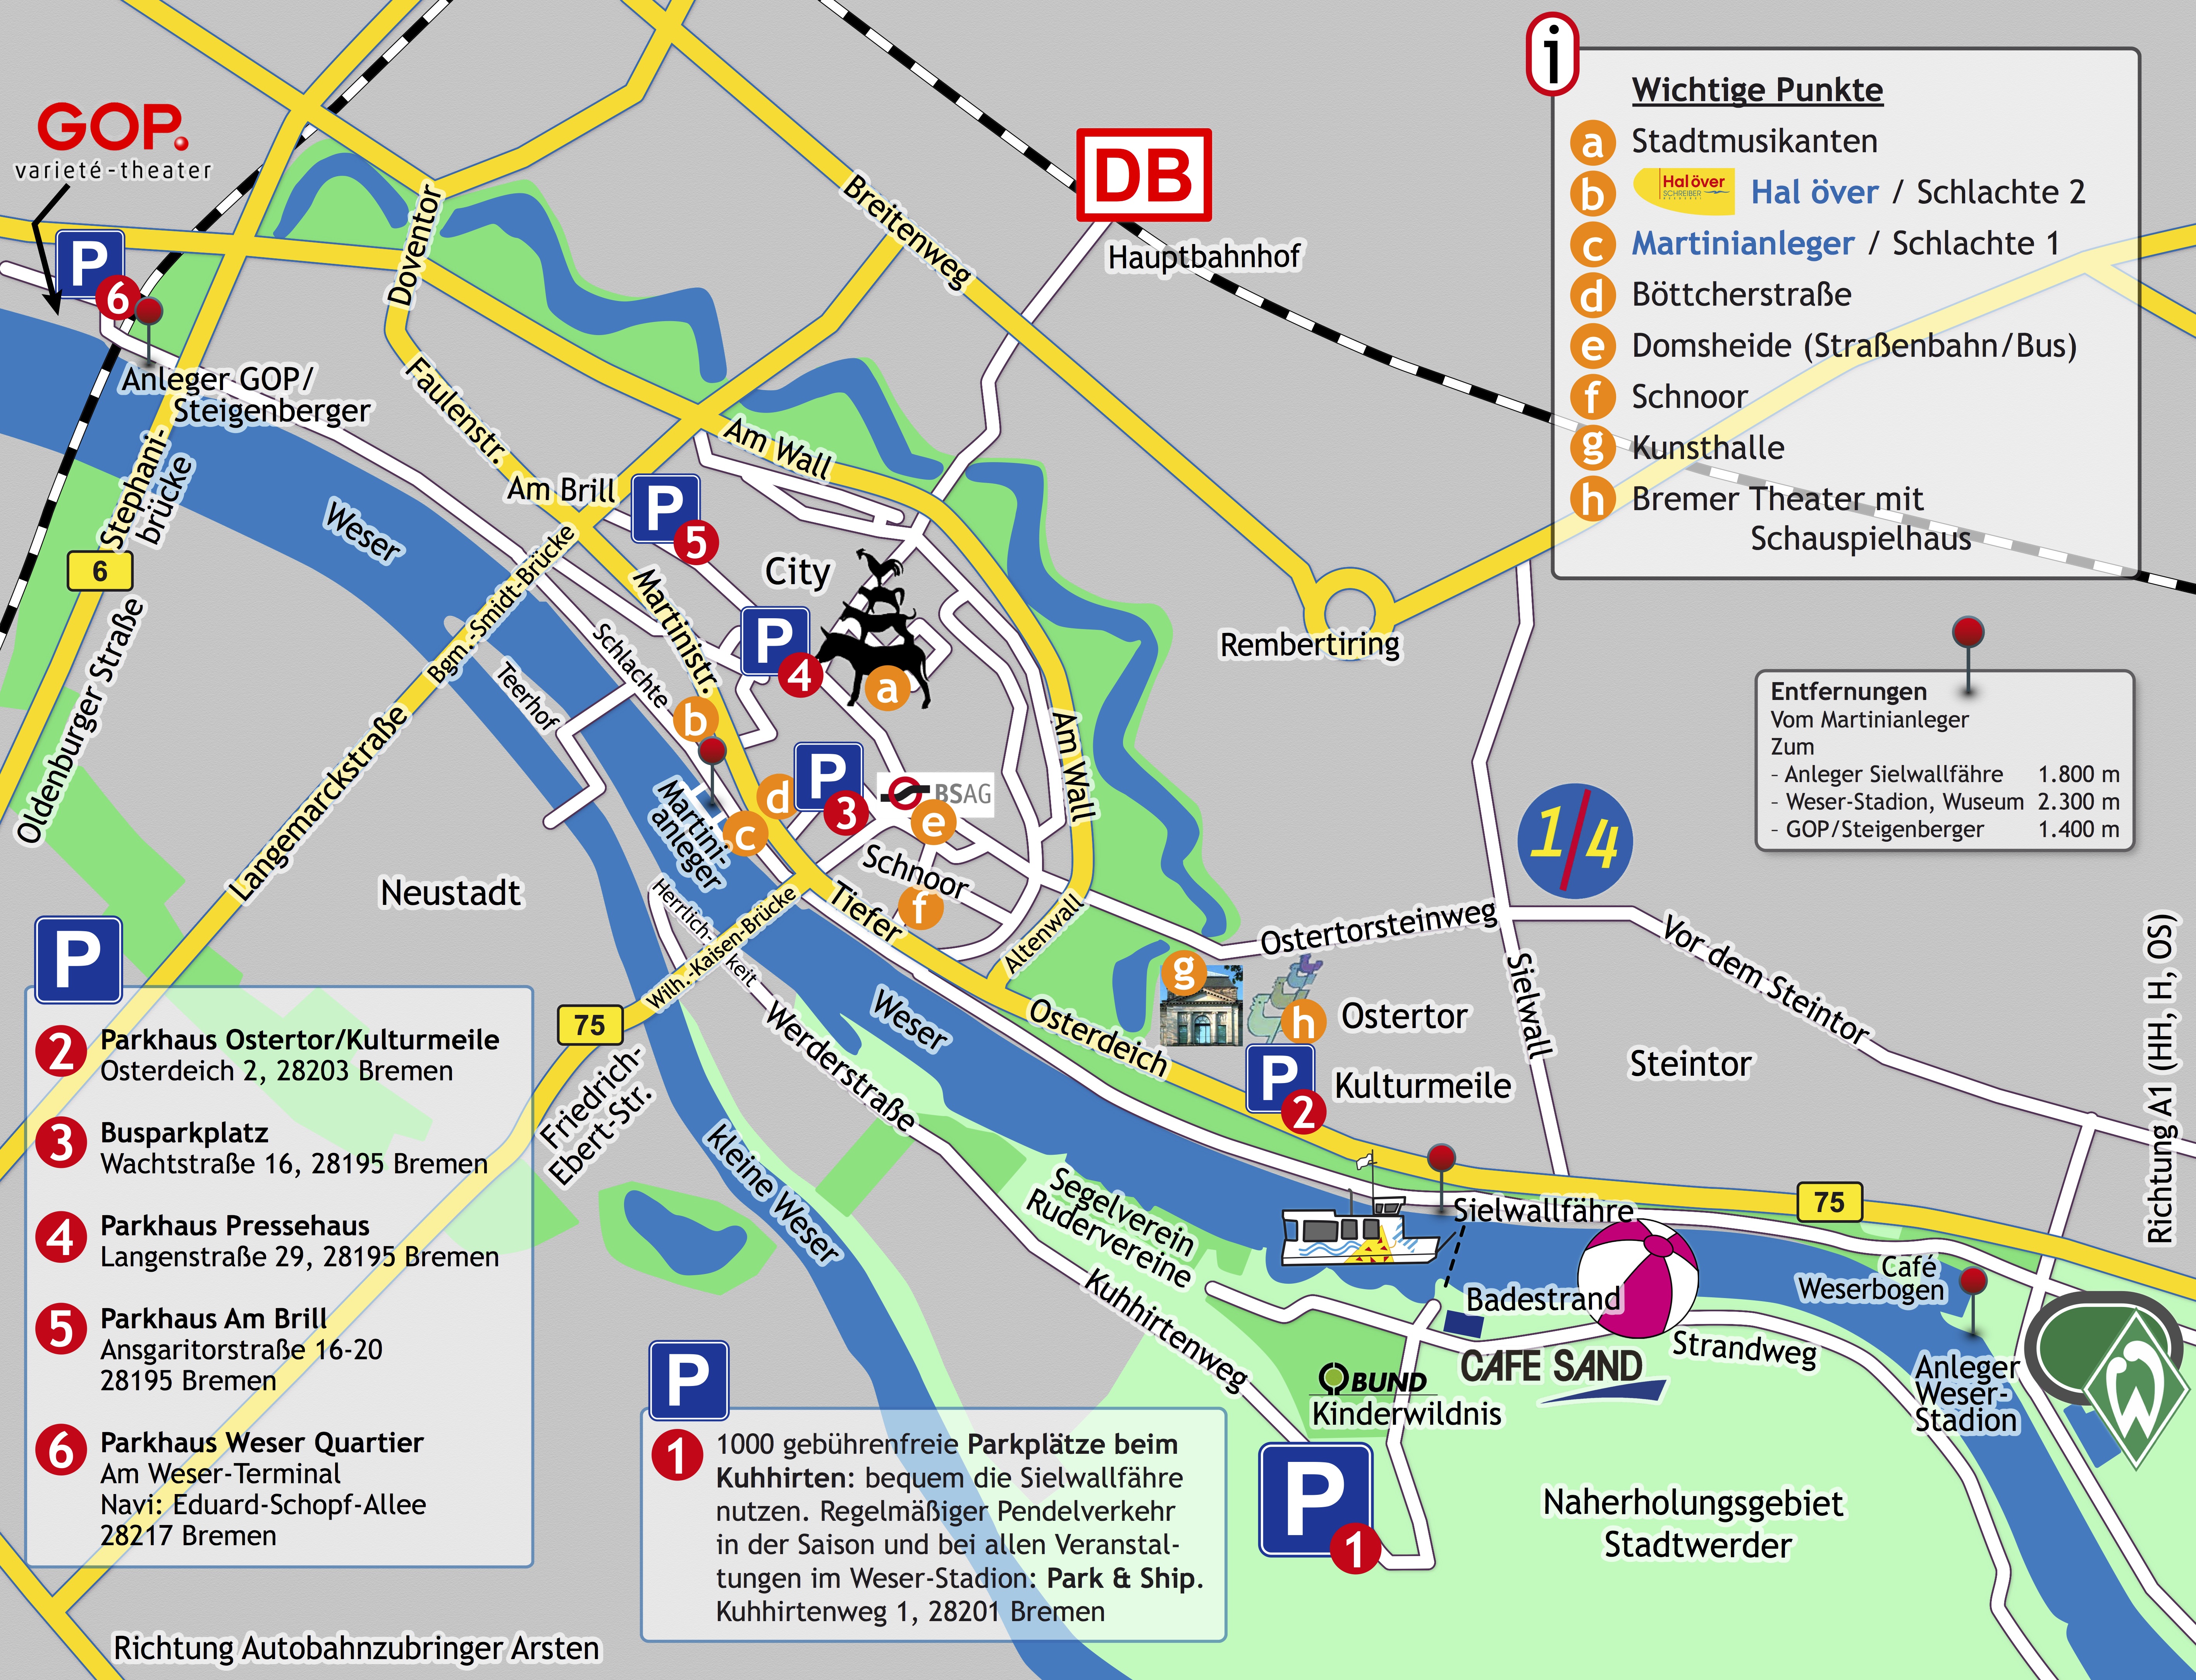
Date. Sunday, 27th of September 2015, boarding starts at 6.45 p.m., event starts at 7 p.m.
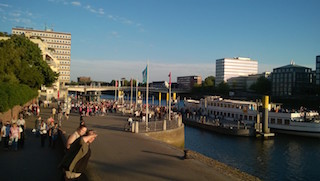
Info. Enjoy a relaxed tour by ship on the river Weser for about 2 hours, with a nice view to the city of Bremen and the nature around. On board a mediteranean buffet will be served; food and beverages are included with the boat trip. Boarding starts at 6.45 p.m. The tour starts at 7 p.m.
Location plan. The event is located at Anleger Bremen, Martinianleger (see c at the plan); the address is Schlachte 1, 28195 Bremen. If you come by car, you can park close to the „Pressehaus“ chargeable car park at Langenstrasse 29 street (see 4 at the plan). If you come by bus or by tram, you can use 4, 5, 6 tramlines or 24, 25 bus-lines to Martinianleger „Domsheide“ stop (see e at the plan).